Help
The AI Visibility Monitor shows how often your website is cited in AI-powered answer engines (such as Perplexity) compared to your competitors. As more users get answers directly from AI instead of traditional search, being named and linked in those answers is what drives traffic and trust. This dashboard is your scoreboard for answer engines.
For a high-level overview, see AI Visibility Monitor on the Airgentic platform. Open the screen directly at admin.airgentic.com/visibility.
Why it matters
When users ask AI assistants questions, the answers often cite specific websites. If your pages aren’t among those citations, your audience is sent to competitors. The Monitor tracks:
- Overall Visibility — The percentage of tracked prompts where your content appears in the citation at all.
- Top 3 Positions — The percentage where you rank in the top 3 cited sources (where most users look).
- Competitor Leaderboard — How you rank against named competitors (appearances, top‑3 count, average rank, visibility %).
- Visibility by topic — Where you’re strongest or weakest across themes.
- Trends over time — Whether you’re gaining or losing ground.
You can run scans on demand, export reports (PDF, CSV, print), and manage domains and questions from the same area.
Getting started
First-time setup
- In the admin console, go to AI Visibility Monitor (from the menu or dashboard).
- If you have no domains yet, click Get Started (or Add Domain from Manage Domains).
- On the Setup page:
- Enter your website URL — Your domain (e.g.
example.com) or full URL. The system will track visibility across that domain and subdomains. - Optional: Regional settings — You can set a country filter for search results and a “geographic identity” (e.g. “Melbourne and Geelong”) so generated prompts are relevant to your region.
- Click Generate Prompts — The system analyses your site and suggests a library of prompts (questions) that users might ask AI assistants about your organisation. You can edit these later.
- Complete the setup (name competitors if you want, review topics and prompts) and activate the library so scans can run.
- Back on the dashboard, click Run First Scan (or Run New Scan). The first run can take a minute or two; the page will refresh when results are ready.
Managing multiple domains
- Use Manage Domains to add more domains (each has its own prompt library and scan history).
- Use the Switch dropdown on the dashboard to change which domain you’re viewing.
- Domain count and scan eligibility depend on your plan (e.g. number of monitored domains, on‑demand vs scheduled scans).
The dashboard
Once you have at least one completed scan, the main view includes:
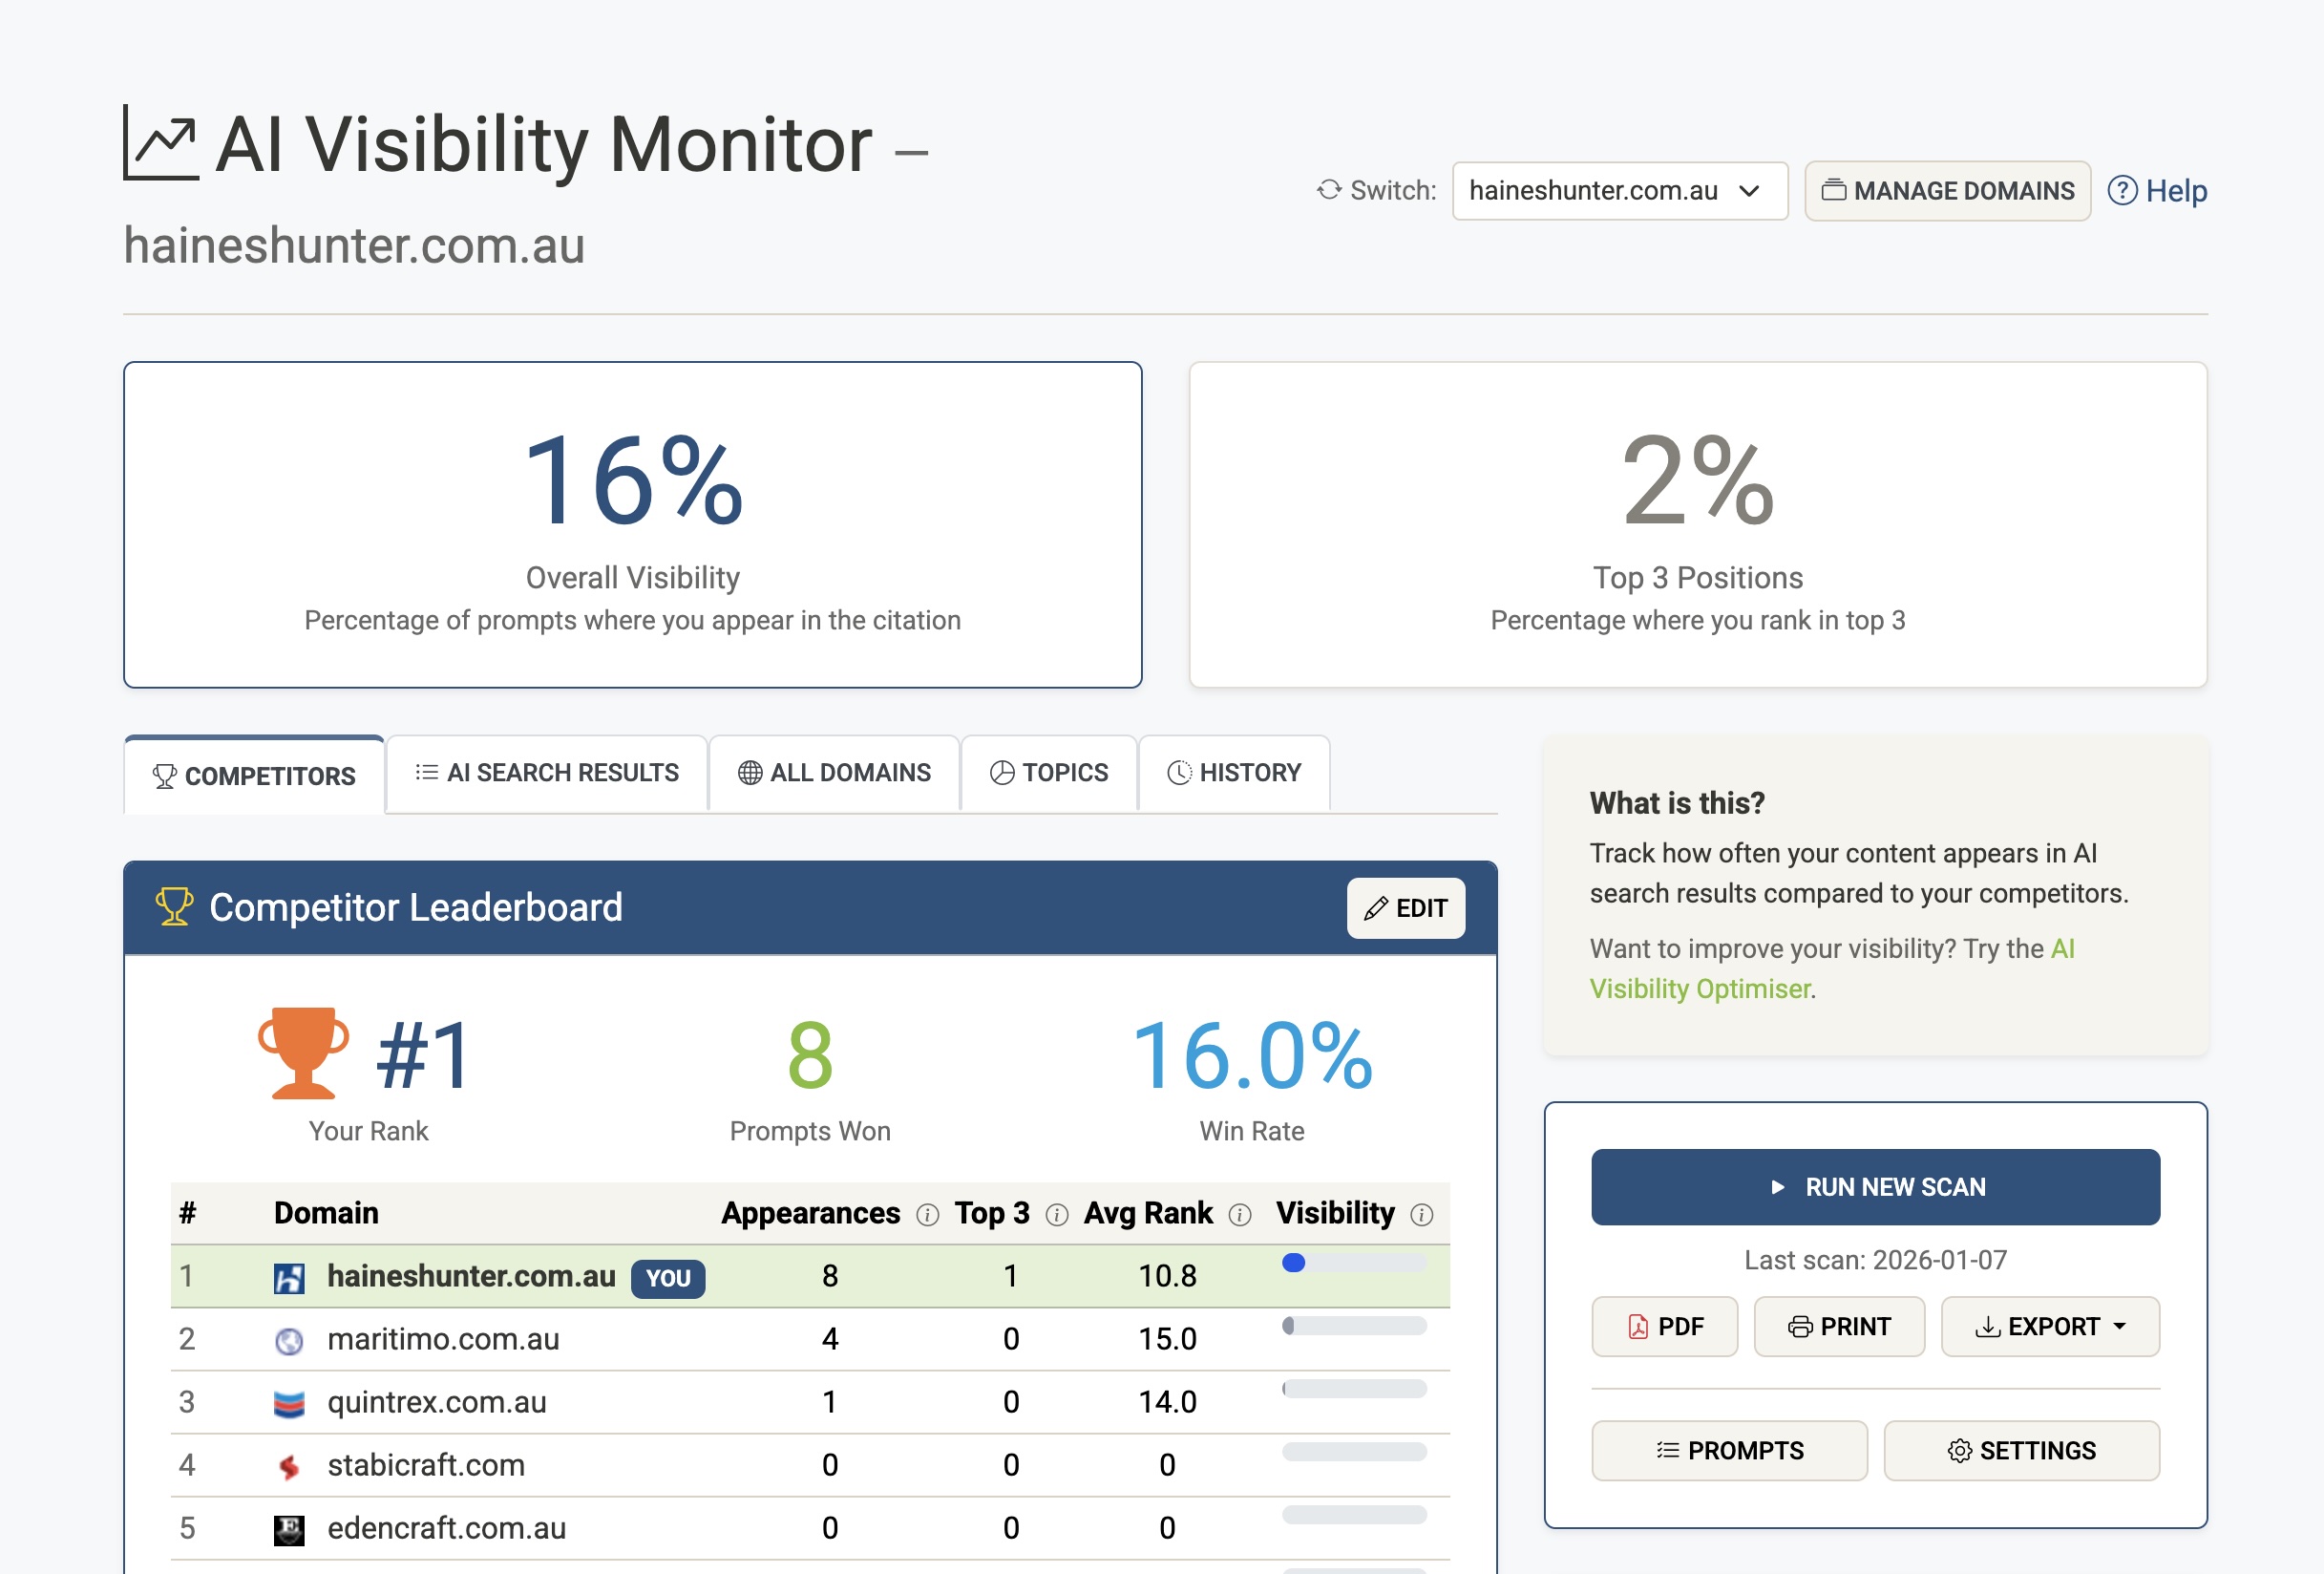
Top metrics (score cards)
- Overall Visibility — Percentage of prompts where you appear in the citation.
- Top 3 Positions — Percentage of prompts where you rank in the top 3 cited sources.
Tabs
- Competitors — Leaderboard of your domain and named competitors: rank, appearances, top‑3 count, average rank, and a visibility bar. Use Edit to add or change competitor domains in setup.
- AI Search Results — Table of all tracked prompts with whether you were cited, your rank, and which sites were cited. Use this to drill into specific questions.
- All Domains — Comparison of your primary domain with your other configured domains (if you have more than one).
- Topics — Performance by topic or category so you can see where you’re strongest and weakest.
- History — Trend over time (e.g. visibility and top‑3 % across scans) so you can see momentum and seasonality.
Side panel
- What is this? — Short explanation and a link to the AI Visibility Optimiser (GEO Advisor) if you want to improve under‑performing pages.
- Run New Scan — Start a new scan for the current domain. Results usually appear within a few minutes; the page may auto-refresh while a scan is running.
- Last scan — Date of the most recent scan.
- Export — PDF, Print, and Export (e.g. CSV) for reports and stakeholder updates.
Tooltips (info icons) next to column headers explain each metric (e.g. “Appearances”, “Top 3”, “Avg Rank”, “Visibility”).
Manage Domains
From the dashboard, click Manage Domains to:
- Add Domain — Start setup for another domain (if your plan allows). Each domain has its own URL, prompt library, competitors, and scan history.
- View all domains — Table of your domains with status (e.g. Active, Draft), created date, last scan date, and latest visibility %.
- Open a domain — Click a domain to go to its dashboard or to edit its setup (URL, regional settings, competitors, prompts).
Domain limits and whether you can use weekly scheduled scans or only on‑demand scans depend on your subscription.
From insight to action
- Low or zero visibility on important prompts — Use the AI Visibility Optimiser (GEO Advisor) to improve those pages (structure, quotability, verifiability). Then run another scan to measure uplift.
- Strong on some topics — Double down with more or better content in those areas to extend your lead.
- Competitors ahead on key queries — Review the AI Search Results tab to see which prompts they win, then refine your content or citations for those intents.
- Reporting — Use PDF or CSV exports for SEO, content, or executive reports to show progress over time.
Scans and scheduling
- On-demand — Click Run New Scan whenever you want fresh data.
- Scheduled — If your plan includes it, you can turn on weekly (or other) scheduled scans so the dashboard and History stay up to date without manual runs.
- History — The History tab and exports let you compare scans over time and prove impact.
FAQs (summary)
- Which answer engines are included? — Perplexity is currently included; others may be added over time.
- How often can we scan? — Depends on your plan: on demand and/or scheduled. Use History to track change.
- We’re not cited at all. — Use GEO Advisor (AI Visibility Optimiser) to see why (e.g. structure, quotability) and get concrete fixes.
- Does this change our rankings? — No. The Monitor only measures and reports; GEO Advisor helps you improve content so you can earn more citations over time.
For more detail and examples, see AI Visibility Monitor | Airgentic.